Tag Archives: Bullish Options strategies
Option Trade of the Week: A Put (Spread) of Gold

January 3, 2023
Happy New Year!
Today we bring you our Option Trade of the Week, an idea generated by our trading team, for your consideration. We’re going in a slightly different direction this week, playing an ETF that easily outperformed the market in 2022.
Before getting to the trade, I want to remind you that our proprietary 10K Strategy has generated average annual gains of 60% for the past five years in actual brokerage accounts (including all commissions) carried out for our subscribers. In 2022, our portfolios beat their underlying stock performance by an average of 22%.
And now, for our Option Trade of the Week subscribers only, we’re running a special new-year sale that saves you more than 50% on a monthly subscription to Terry’s Tips premium service. For just $98, you’ll get:
- A month of all trade alerts in our four portfolios, giving detailed instructions for entering and exiting positions.
- Four to five (depending on the month) weekly issues of our Saturday Report, which shows all the trades and positions for our four portfolios, a discussion of the week’s trading activity and early access to our Option Trade of the Week.
- Instructions on how to execute the 10K Strategy on your own.
- A 14-day options tutorial on the opportunities and risks of trading options.
- Our updated 10K Strategy white paper, a thorough discussion of the strategy basics and tactics.
- Full-member access to all our premium special reports that can make you a wiser and more profitable options trader.
To become a Terry’s Tips Insider Member, just Click Here, select Sign Up Now and use Coupon Code D21M to start a monthly subscription to Terry’s Tips for half off. You can cancel after a month but of course still keep all the valuable reports.
We look forward to having you join us in 2023! Now on to the trade …
A Put (Spread) of Gold
With no earnings reports to trade in the past week, we turn more macroeconomic with a bullish play on gold. And the easiest way to play gold is to trade the SPDR Gold Trust ETF (GLD), which, according to ETF.com, “tracks the gold spot price … using gold bars held in London vaults.” It doesn’t get much more straightforward than that.
The World Gold Council – admittedly a biased source – projected a “stable but positive performance for gold” in 2023. However, their annual outlook cited “an unusually high level of uncertainty surrounding consensus expectations for 2023.” The report cited the greater likelihood of a severe downturn or mild recession for the global economy, which would be good for gold, versus the downward pressure from a soft landing.
On the charts, GLD had a flat 2022 (technically down 0.8%), which is far better than any stock index. After hitting a 2-1/2-year low in early November, the ETF has gained more than 12%. The rally has ridden the support of the 20-day moving average, which hasn’t allowed a single daily close below it since the uptrend began. Note that the short put strike of our bullish put spread is sitting just below the 20-day.
While the Gold Council may be hedging its bullish bets, options players clearly are not. Looking at option prices in the 17 Feb series, calls are priced significantly higher than equally out-of-the-money puts. In fact, the 175 call is priced 50% higher than the 164 put. I like seeing where traders are putting their money rather than what they say on TV. And this tells me that options traders see substantially more risk to the upside.
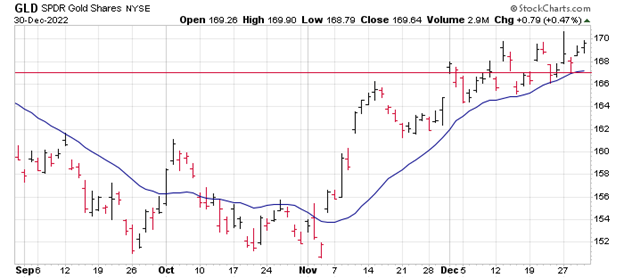
This trade is based on GLD’s rally continuing along the 20-day moving average (blue line) for at least the next couple of months. If you agree that there’s more upside for GLD, consider the following trade that relies on the ETF staying above $167 (red line) through expiration in 7 weeks:
Buy to Open the GLD 17 Feb 165 put (GLD230217P165)
Sell to Open the GLD 17 Feb 167 put (GLD230217P167) for a credit of $0.60 (selling a vertical)

This credit is $0.02 less than the mid-point price of the spread at Friday’s $169.64 close. Unless GLD surges quickly, you should be able to get close to that price.
The commission on this trade should be no more than $1.30 per spread. Each spread would then yield $58.70. This trade reduces your buying power by $200, making your net investment $141.30 per spread ($200 – $58.70). If GLD closes above $167 on Feb. 17, both options will expire worthless and your return on the spread would be 42% ($58.70/$141.30)
ULTA is More than Skin Deep
December 5, 2022
Ulta Beauty (ULTA) reported impressive earnings on Thursday after the bell that beat estimates on all counts. Earnings came in more than a dollar higher than expectations, while revenue beat by more than 4%. Same-store sales came in a whopping 60% above the analyst number. Moreover, ULTA raised full-year guidance for both earnings and sales. Significantly, the common complaints of supply chain constraints and slower consumer spending were absent from ULTA’s report and follow-up call.
Analysts cheered the news, hitting the stock with several target price increases, though there were no rating upgrades. Even so, the consensus price target is just a mere 4% above ULTA’s Friday close, while more than half the covering analysts rate the stock a hold. This suggests that future upgrades and target increases are possible, which could give the stock a boost.
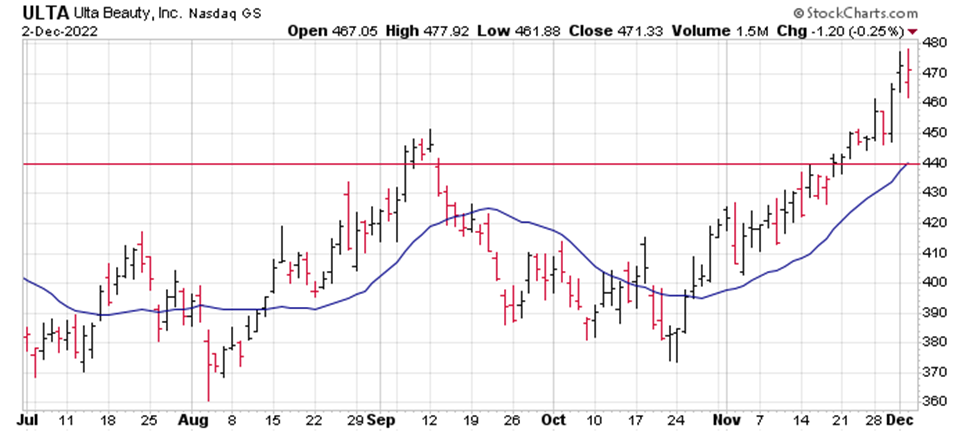
Despite the solid report, ULTA was flat on Friday. Perhaps this is because the stock is on an impressive 26% rally since late October. In fact, ULTA hit an all-time high on Friday. This rally has been tracked by the 20-day moving average, although the trendline has not been tested for the past month. We are going with a safer trade this week, going further out of the money than usual with the short strike that is sitting right on the 20-day, as shown in the chart.
This trade is based on ULTA continuing its rally on the heels of a strong earnings report. That said, we are giving the stock about 7% of downside room before the spread moves into the money. If you agree that ULTA will continue its rally – or at least remain atop the 20-day (blue line) – consider the following trade that relies on the stock staying above $440 (red line) through expiration in seven weeks:
Buy to Open the ULTA 20 Jan 435 put (ULTA230120P435)
Sell to Open the ULTA 20 Jan 440 put (ULTA230120P440) for a credit of $1.00 (selling a vertical)
This credit is $0.05 less than the mid-point price of the spread at Friday’s $471.33 close. Unless ULTA surges quickly, you should be able to get close to that price.
The commission on this trade should be no more than $1.30 per spread. Each spread would then yield $98.70. This trade reduces your buying power by $500, making your net investment $401.30 per spread ($500 – $98.70). If ULTA closes above $440 on Jan. 20, both options will expire worthless and your return on the spread would be 25% ($98.70/$401.30).
A Stock With Some Bite
November 14, 2022
Oil and gas producer Diamondback Energy (FANG) – which may have the best ticker symbol in finance – reported earnings on Monday that beat analyst expectations on both the top and bottom lines. Higher oil prices led to huge jumps in net income (+82%) and revenue (28%) compared to a year earlier. For the record, the average price of oil jumped 32% from last year’s third quarter.
Analysts were bullish on the results, reacting with several price target increases. The average price target now stands 9.6% above Friday’s close, which seems reasonable for an energy stock.
FANG had traded mostly flat in 2022 … until late September. That’s when the stock went on a major rally that has covered 48% in just seven weeks. In fact, a late-week surge allowed the stock to post all-time intraday and closing highs on Friday. The stock has been riding above the support of its 20-day moving average since closing above this trendline in early October.
This trade is based on FANG continuing its rally or at least not pulling back below the 20-day (blue line), which will cross above the short strike of our put spread (red line) within the next couple of days. Note that FANG’s strike prices are unusual (155.35 and 152.7), though that should have no impact on the trade or profit potential.
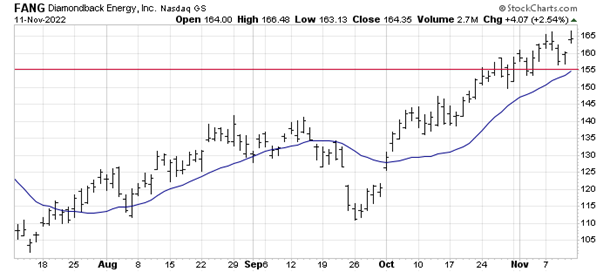
If you agree that FANG will continue to respect the 20-day moving average, consider the following trade that relies on the stock staying above $155.35 through expiration in five weeks:
Buy to Open the FANG 16 Dec 152.7 put (FANG221216P152.7)
Sell to Open the FANG 16 Dec 155.35 put (FANG221216P155.35) for a credit of $0.75 (selling a vertical)
This credit is $0.05 less than the mid-point price of the spread at Friday’s $164.35 close. Unless FANG surges quickly, you should be able to get close to that price.
The commission on this trade should be no more than $1.30 per spread. Each spread would then yield $73.70. This trade reduces your buying power by $265, making your net investment $191.30 per spread ($265 – $73.70). If FANG closes above $155.35 on Dec. 16, both options will expire worthless and your return on the spread would be 38% ($73.70/$191.30).
Go With VLO
October 31, 2022
Go With VLO
Oil refiner Valero Energy (VLO) reported earnings this week that either missed or beat both profit and revenue estimates, depending on the source. I won’t quibble with who’s right or wrong. What’s important is that revenue and profits soared above the figures from a year ago. Moreover, VLO’s CEO said that product demand surpassed 2019 levels.
The report was met with target price increases from several analysts. What’s interesting about VLO compared to most stocks, though, is that the average target price is only 9% above Friday’s closing price. In other words, it’s reasonable. To me, that adds some weight to the price increases we saw this week.
On the charts, the stock is down a bit since earnings. But the month-long uptrend remains intact, assisted by the 20-day moving average. The shares have not closed a day below this trendline in October, a period that includes a pullback that tested support. Based on this support, we’re going with a put credit spread with the short put strike sitting right on the 20-day (blue line) and will soon be below it. Thus, the stock will have to break through the trendline to move the spread into the money.
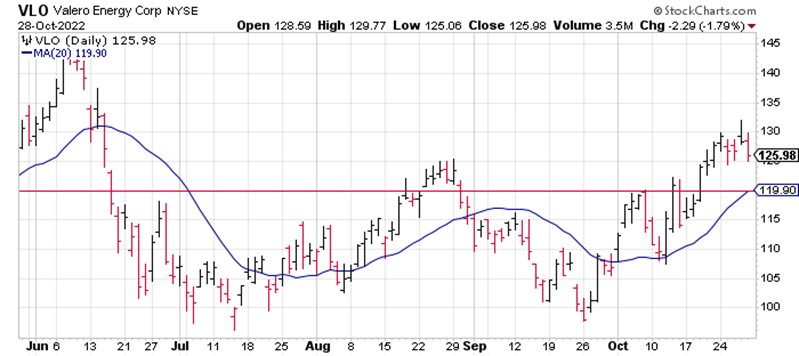
If you agree that VLO will continue to respect the 20-day, consider the following trade that relies on the stock staying above $120 (red line) through expiration in seven weeks:
Buy to Open the VLO 16 Dec 115 put (VLO221216P115)
Sell to Open the VLO 16 Dec 120 put (VLO221216P120) for a credit of $1.65 (selling a vertical)
This credit is $0.02 less than the mid-point price of the spread at Friday’s $125.98 close. Unless VLO surges quickly, you should be able to get close to that price.
The commission on this trade should be no more than $1.30 per spread. Each spread would then yield $163.70. This trade reduces your buying power by $500, making your net investment $336.30 per spread ($500 – $163.70). If VLO closes above $120 on Dec. 16, both options will expire worthless and your return on the spread would be 49% ($163.70/$336.30).
Pumped Up
Pumped Up
Much is made of gas prices declining for so many weeks in a row (I think we’re at 13 and counting). And that’s great for drivers. But what about the oil companies. Don’t they suffer when pump prices decline? Apparently not.
Gas prices peaked in mid-June and have dropped about 25% since then. But Chevron (CVX) has gained more than 5% during that period. For the year, CVX is up 33%. Its only major blip this year was the June swoon that pulled all stocks lower. But the decline was supported by the 200-day moving average, which allowed just a handful of daily closes below it in mid-July.
This trade is based on the strength of oil companies continuing for the next couple of months. More specifically, it is relying on the continued support of the 200-day. Note that the short put of our spread is right on the 200-day (blue line) and will be below it given the trendline’s current slope. Thus, CVX will have to penetrate that support to move the spread into the money.
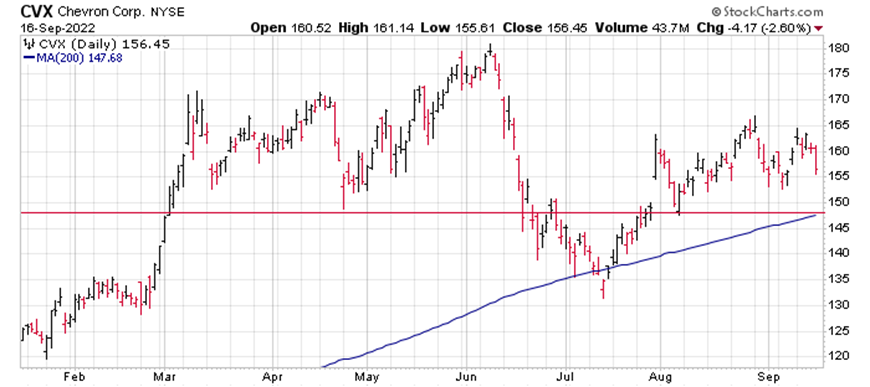
If you agree that CVX will respect the 200-day, consider the following trade that relies on the stock staying above $148 (red line) through expiration in six weeks:
Buy to Open the CVX 28Oct 145 put (CVX221028P145)
Sell to Open the CVX 28Oct 148 put (CVX221028P148) for a credit of $0.75 (selling a vertical)
This credit is $0.05 less than the mid-point price of the spread at Friday’s $156.45 close. Unless CVX pops quickly, you should be able to get close to that price.
The commission on this trade should be no more than $1.30 per spread. Each spread would then yield $73.70. This trade reduces your buying power by $300, making your net investment $226.30 per spread ($300 – $73.70). If CVX closes above $148 on October 28, both options will expire worthless and your return on the spread would be 33% ($73.70/$226.30).
Warp Speed for This Lithium Producer
September 12, 2022
Warp Speed for This Lithium Producer
Sociedad Quimica y Minera de Chile (SQM) producers highly sought after commodities, most notably lithium and potassium fertilizers. Though it missed on earnings in its August earnings report, it easily beat on sales. A couple of analysts raised their price target after the news, though the overall mood toward the stock is between a buy and a hold.
But what do analysts know? SQM is up 120% this year (not a typo) … and it pays a dividend of more than 11%. The stock has recovered what it lost following earnings and came within four cents of hitting an all-time high in Friday’s trading. Though it has traded mostly sideways for the past three months, the overall uptrend remains intact, as the stock continues to put in higher lows. Plus, its 20-day and 50-day moving averages are pointed higher.
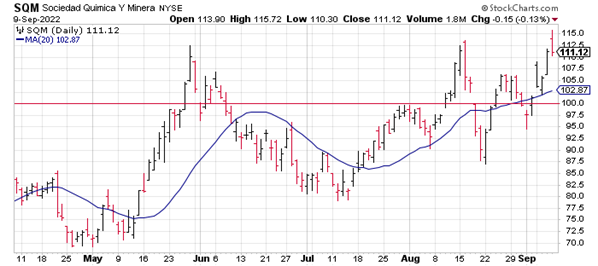
This trade is a play on SQM’s continued strength as it sits in one of the most favorable sectors within the global economy – supplying EV battery makers. We are thus going with a put credit spread with the short put sitting below the 20-day moving average (blue line).
If you agree that SQM will continue its uptrend, consider the following trade that relies on the stock staying above $100 (red line) through expiration in six weeks:
Buy to Open the SQM 21Oct 95 put (SQM221021P95)
Sell to Open the SQM 21Oct 100 put (SQM221021P100) for a credit of $1.10 (selling a vertical)
This credit is $0.02 less than the mid-point price of the spread at Friday’s $111.12 close. Unless SQM pops quickly, you should be able to get close to that price.
The commission on this trade should be no more than $1.30 per spread. Each spread would then yield $108.70. This trade reduces your buying power by $500, making your net investment $391.30 per spread ($500 – $108.70). If SQM closes above $100 on October 21, both options will expire worthless and your return on the spread would be 28% ($108.70/$391.30).
No Garden Party
Darden Restaurants (DRI) reported earnings this week that beat on both revenue and profits. But the owner of such popular chains as Olive Garden, LongHorn Steakhouse and Capital Grille was beset by higher food, beverage and labor costs even as customers are more comfortable eating out again.
Analysts weighed in with a plateful of target price decreases, although there were no rating downgrades. This has been common for most stocks, as analysts re-adjust their targets amid the 2022 swoon. Nevertheless, some targets are now barely above the current share price, which does not inspire confidence about DRI’s near-term price action.
The stock reacted with a small increase on Thursday and then popped 3.6% on Friday. But most stocks surged on Friday, so it doesn’t appear that earnings gave DRI a boost. Although the stock is up 8% off a 52-week low hit last week, it is bumping into its 20-day moving average at the 120 level (red line in chart). The 50-day moving average lies overhead at the 125 level (blue line). Although DRI has managed to overtake the 50-day at times, it ultimately retreats into a tailspin. Given this history, we’re using a bearish call credit spread with the short call strike (green line) sitting right on the 50-day.
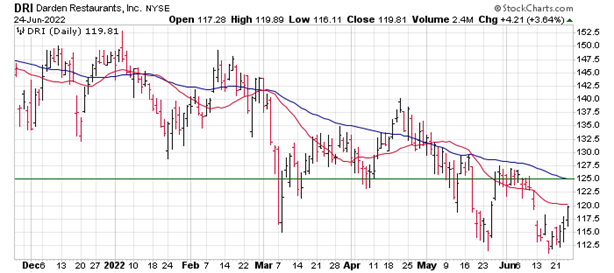
If you agree that DRI will continue its overall downtrend, consider the following trade that relies on the stock staying below $125 through expiration in eight weeks.
Buy to Open DRI 19Aug 130 call (DRI220819C130)
Sell to Open DRI 19Aug 125 call (DRI220819C125) for a credit of $1.50 (selling a vertical)
This credit is $0.05 less than the mid-point of the option spread when DRI was trading at $120. Unless the stock drops quickly from here, you should be able to get close to this amount.
Your commission on this trade should be no more than $1.30 per spread. Each spread would then yield $148.70. This trade reduces your buying power by $500 and makes your net investment $351.30 ($500 – $148.70) for one spread. If DRI closes below $125 on August 19, both options will expire worthless and your return on the spread would be 42% ($148.70/$351.30).
Paypal (PYPL) – A Longstanding Favorite Among Analysts
This week we are looking at another of the Investor’s Business Daily (IBD) Top 50 List companies. We use this list in one of our options portfolios to spot outperforming stocks and place option spreads that take advantage of the momentum.
A majority of analysts have consistently given PYPL a Strong Buy rating over the past year, and rightfully so. The stock is up 74% YTD even though it’s down about 13% from the all-time high posted last month. The following two articles shed some light on why investors are drawn to the company: Robinhood Investors Love PayPal. Should They? and Is PayPal Stock A Buy Right Now? Here’s What Earnings, Charts Show.
Technicals
PYPL has mostly traded sideways for the last four months which is not that surprising as stocks often fall into a period of consolidation after a powerful rally. The 100-Day moving average has come into play and while there have been a few days where PYPL traded below it, buyers have been quick to lift the stock back above it. With PYPL trading close to the lower bound of the recent range, this could be an attractive price point to consider a long position.

PYPL Chart November 2020
If you agree there’s further upside ahead for PYPL, consider this trade which relies on the stock remaining above the $185 level through the expiration in five weeks.
Buy To Open PYPL 18DEC20 180 Puts (PYPL201218P180)
Sell To Open PYPL 18DEC20 185 Puts (PYPL201218P185) for a credit of $1.83 (selling a vertical)
This credit is $0.02 less than the mid-point of the option spread when PYPL was trading near $189. Unless the stock rallies quickly from here, you should be able to get close to this amount.
Your commission on this trade will be only $1.30 per spread. Each spread would then yield $181.70. This reduces your buying power by $500 and makes your investment $318.30 ($500 – $181.70). If PYPL closes at any price above $185 on December 18, both options will expire worthless, and your return on the spread would be 57% ($181.70 / $318.30), or 650% annualized.
Changes to Investor’s Business Daily (IBD) Top 50 This Week:

IBD Underlying Updates November 14, 2020
We have found that the Investor’s Business Daily Top 50 List has been a reliable source of stocks that are likely to move higher in the short run. Recent additions to the list might be particularly good choices for this strategy, and deletions might be good indicators for exiting a position that you might already have on that stock.
As with all investments, you should only make option trades with money that you can truly afford to lose.
Happy trading,
Terry
Follow Terry's Tips on Twitter
Like Terry's Tips on Facebook
Watch Terry's Tips on YouTube