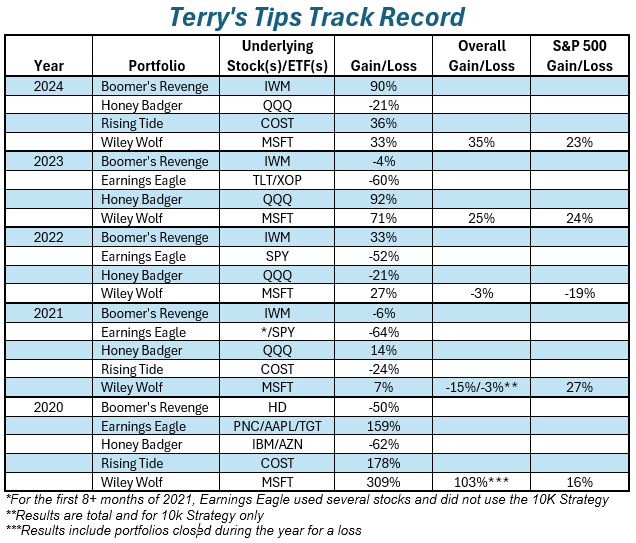
from the desk of Dr. Terry F Allen

Skip navigation

Member Login  |  Contact Us  |  Sign Up

support@terrystips.com

The Terry’s Tips Track Record

Five-Year Track Record

YearGain / Loss
2017+113%
2018-40%
2019+103%
2020+122%
2021-2%
Average per year+59%

YTD 2022 Track Record – We Crushed the Market Averages!

The extreme market volatility that existed in late 2021 continued into 2022 and most of the big moves were on the downside, two things that negatively impact the success of our 10K Strategy. This caused us to make some modifications on the way we carried out our weekly trades.

First, we have held about half our investment in cash so that when IVs fall to historically lower levels, (as they inevitably will) we won’t be crushed by our long positions falling so much.  Second, we have resisted the temptation to adjust every time the market surges one way or the other.  It usually reverses itself shortly after big moves in either direction.  And finally, we have maintained about half the portfolios in a delta-negative position so if the market does fall, some of them will do well.

The bottom line is that the composite gain for all four portfolios was 8.4% through October 15, 2022.  During this period, the market (S&P 500) was down 25% and the Nasdaq has dropped over 38%. Clearly, we have outperformed the underlying averages by a wide margin. The 10K Strategy (with our recent modifications) has handled this falling market and unusually high volatility quite well. We have not enjoyed the near-60% annual gains we have averaged over the last five years, but very few investors have matched our results for 2022. Have you? Would you be happy if your investment portfolio had gained 8.4% for the first nine months of 2022?

Track Record for 2021

We carried out our 10K Strategy with 4 portfolios in 2021, each trading options on a separate underlying stock or ETF. For the first nine months of the year, weekly volatility of our underlying stocks or ETFs rose to extreme levels. However, with three months to go, our composite portfolio average was above 20% for the year. Then volatility soared, and extended into 2022. Our final results were a disappointing loss of 2.4% for the year, as reported in our January 1, 2022 Saturday Report sent to subscribers:

PortfolioStock Start Current  Change     % 
   Value Value  
Boomers RevengeIWM       10,000      9,454   -546– 5.5%
Honey BadgerQQQ       10,000     11,350   +1,350 +13.5%
Rising TideCOST       10,000     7,566    -2,434 -24.3%
Wiley WolfMSFT       10,000     10,664     +664 +6.6%
  Totals        40,000     39,034     -966 -2.4%
2021 Results

Track Record for 2020 

We carried out our 10K Strategy with 5 portfolios in 2020, each trading options on a separate underlying stock or ETF.  During the year, we dropped one of the portfolios when the underling became too volatile for the options prices to handle, and we suffered a 50% loss on that portfolio.  

The other four 10K Strategy portfolios prospered, however, and chalked up an average gain of 122% for all 5 portfolios.  This record meant that in 3 of the past 4 years, our 10K Strategy portfolios have enjoyed average annual gains of over 100%.

At the end of 2020, three portfolios – Wiley Wolf (MSFT), Rising Tide (COST), and Earnings Eagle (TGT) – all more than tripled in value, led by the Wolf’s quadruple (this portfolio started out 2020 with $10,000 and ended up the year with $40,934 (after paying all commissions). This result shows how absurdly successful our strategy can be when the market edges higher and volatility is muted throughout the year. Fortunately, this is the pattern for most market years.

Track Record for 2019  

Our results for 2019 were extraordinary.  It was a good year for the market in general.  The S&P 500 (SPY) gained about 29%.  Just about any equity investment probably made money.  However, the average gain for our 10K Strategy portfolios exceeded 103%, or well more than 3 times as great as the market as a whole.   

Track Record for 2018

The success of the 10K Strategy is dependent on selecting underlying stocks or ETFs that stay flat or move higher.  The year 2018 was the only year in the past 10 years when the market fell during the calendar year.  This was especially true in the last quarter when prices fell across the board.  Our 10K Strategy portfolios all lost money in 2018, a dramatic difference from 2017 when the composite average portfolio gained over 113%.  Our worst 2018 performer was based on Facebook (FB). FB fell from a high of over $218 to end at $135, a drop of 38%.  Our portfolio lost over 90%, a huge reversal from the 700%+ gain that it had enjoyed in 2017 (see below).  

We carried out ten portfolios in 2018, many of which were experiments with strategies totally different from the basic 10K Strategy that has become the only strategy that we currently use. It was a down year for the market, and our composite loss for the year was 39.9% after culling out the portfolios which bore no resemblance to our basic strategy or which did not operate for the entire year.

The Terry’s Tips 2017 Track Record Results 

The year has ended, and it is time to record the results for 2017. The composite average of our 10 portfolios gained 113% for 2017, just about the best year we have enjoyed in our 16 years of publishing Terry’s Tips. Only one portfolio (Honey Badger) lost money (and it covered the entire loss for the year in the first week of 2018).

Each of our portfolios is carried in a separate brokerage account and include all commissions. We currently carry out four portfolios at Terry’s Tips is available for Auto-Trade at Tradier or TastyWorks (so you can follow a portfolio and never have to make a trade on your own).    All of these portfolios can be carried out inside an IRA.   Paying subscribers can follow the results of all the portfolios. Some newsletters only reveal their winning portfolios to all subscribers, but at Terry’s Tips, we disclose every trade and every position for every portfolio at all times.  

All results include commissions at the standard rate charged by Tradier for Terry’s Tips subscribers.  Many newsletters conveniently (for them) do not include commissions when they report their trading results.  By the way, our subscription rates are considerably less than just about any other options newsletter.

Earlier Years Results

Terry’s Tips has carried out actual portfolios for subscribers to follow (or auto-trade if they wished) since 2003. In most of these years, the option portfolios have beaten the market averages by a very large margin. In some years, the portfolios have incurred losses similar to the magnitude of the market losses.

Option trading involves leverage, and leverage works in both directions. Gains (and losses) are often greater than changes in the market. However, we have tried to minimize the losses in down years so that our losses are less than those of the markets in general, and to enjoy greater gains than the markets in good years. Most of the time, we have been successful in carrying out these goals. Of course, we must remind everyone that past performance is no guarantee that future results will be as great as they have been in the past, in spite of our expectations that they will do just that.

TERRY’S TIPS STOCK OPTIONS TRADING BLOG

September 11, 2023

September 12, 2023

Dear [[firstname]],

No marketing this week … you deserve a week off. Let’s get to the trade …

Here is your Option Trade of the Week, as given to our Terry’s Tips Insider Members as part of the Saturday Report. With no earnings reports to play with, I’m going with an ETF that hasn’t done a whole lot lately. To make the trade more attractive, the credit went up slightly today (for a change), so you should be able to enter tomorrow at a decent price.

Good luck with the trade …

Health Bear … Sort Of

With no notable earnings reports this week, we’re turning to an ETF that’s done little of late. It’s the SPDR Health Care ETF (XLV), which holds such heavyweights as UnitedHealth Group (UNH), Eli Lilly (LLY), Merck (MRK), Johnson & Johnson (JNJ) and Amgen (AMGN) among its top 10 holdings. This trade is a bearish credit spread, though I’m not particularly bearish on the sector. I’m not bullish, either. But that’s the beauty of credit spreads. You can be more neutral than directional and still collect a maximum profit so long as the short strike remains out of the money. It’s a forgiving strategy that caters to those who don’t have a strong directional bias.

I’m using a bearish call spread for this trade because the overhead 135 level has proven difficult for XLV to overcome throughout most of 2023. In fact, the ETF has closed above this mark only a handful of times since January. Recent attempts to take out 135 were rejected in April, August and July.

Although XLV currently sits below all its major moving averages, it hasn’t respected these trendlines for support or resistance for much of the year. So, even though the 20-day, 50-day and 200-day moving averages lie between the current XLV price and the 135 level, I’m not relying on their potential for resistance. This is more about the 135 level acting as a top in recent months.

Note that this trade extends into the start of the next earnings season. In fact, four of XLV’s top 10 holdings, including UNH and JNJ, report before the spread expires on Oct. 20. However, given XLV’s performance this year (down around 3%) and the fact that it’s gone nowhere for seven months, I’m not expecting earnings from a few XLV names to give the ETF a huge shot in the arm prior to expiration.

If you agree that XLV will continue its “meh” performance, consider the following credit spread trade that relies on XLV staying below $135 (blue line) through expiration in 6 weeks:

Buy to Open the XLV 20 Oct 137 call (XLV231020C137)
Sell to Open the XLV 20 Oct 135 call (XLV231020C135) for a credit of $0.40 (selling a vertical)

This credit is $0.04 less than the mid-point price of the spread at Friday’s $132.06 close.  Unless XLV sinks sharply at the open on Monday, you should be able to get close to that price.

The commission on this trade should be no more than $1.30 per spread. Each spread would then yield $38.70. This trade reduces your buying power by $200, making your net investment $161.30 per spread ($200 – $38.70). If XLV closes below $135 on Oct. 20, the options will expire worthless and your return on the spread would be 24% ($38.70/$161.30).  

Thank you again for being a part of the Terry’s Tips newsletter.

Happy trading,

Jon

September 5, 2023

September 5, 2023

With the market throwing off bullish vibes this week, we’re going with another bullish trade on one of the few notable names that reported earnings this week: athletic apparel maker Lululemon Athletica (LULU). The company reported solid numbers after the bell on Thursday, including an 18% revenue jump that surpassed the analyst estimate. Earnings also handily beat expectations. To complete the trifecta, full-year revenue and earnings guidance came in above the analyst estimate.

Analysts were seemingly thrilled with the numbers, as a slew of price target increases poured in. But many raised the price by only a few dollars, which is meaningless for a $400 stock. After the flurry, the new average target price stands only around 3% above Friday’s close. And there were no ratings changes, leaving the current consensus in the buy/outperform category.

So, while analysts appear bullish, nobody seems willing to bet the mortgage payment on LULU. I’m fine with that, however, as I hesitate to jump on a bandwagon that’s already full. I like to see some room for upgrades and target price increases.

Traders apparently thought differently, pushing LULU up 6% on Friday to an 18-month high. It also propelled the stock above a trading range that has captured most of the price moves of the past five months. Note in the chart how the 20-day and 50-day moving averages have combined forces near the 380 level. I expect these trendlines to rise above the top of the range around $385 within the next week or two. That should provide a multi-layered tier of support to keep the short put of our spread out of the money.

The other technical driver of this trade is the fact that LULU tends to stay flat for several weeks after earnings. That is, the stock doesn’t tend to stray too far from its initial post-earnings move. Given that we have around a 5% cushion combined with the trading range and potential trendline support, I like the odds of LULU staying above the key $385 mark through expiration.

If you agree that the stock will respect the top of its trading range, consider the following credit spread trade that relies on LULU staying above $385 (green line) through expiration in 6 weeks:

Buy to Open the LULU 13 Oct 380 put (LULU231013P380)
Sell to Open the LULU 13 Oct 385 put (LULU231013P385) for a credit of $1.05 (selling a vertical)

This credit is $0.02 less than the mid-point price of the spread at Friday’s $404.19 close.  Unless LULU surges at the open on Tuesday, you should be able to get close to that price.

The commission on this trade should be no more than $1.30 per spread. Each spread would then yield $103.70. This trade reduces your buying power by $500, making your net investment $396.30 per spread ($500 – $103.70). If LULU closes above $385 on Oct. 13, the options will expire worthless and your return on the spread would be 26% ($103.70/$396.30).  

**You can save more than 50% on a monthly subscription to Terry’s Tips. Just Click Here, select Sign Up Now and use Coupon Code D21M to start a monthly subscription to Terry’s Tips for half off.**

August 7, 2023

August 7, 2023

Room to Run

Although this was the busiest week of earnings season – loaded with big tech names – we’re going to wade into calmer waters with Marriott International (MAR). The company runs the gamut of hotel offerings, operating under 30 brand names in 138 countries. The company reported on Tuesday before the open, beating estimates on both revenue and earnings. The hotelier also raised its Q3 and FY 23 earnings projections, which also are above expectations. MAR’s CFO noted that domestic travel demand continues to grow while international markets are starting to heat up. Business and group travel is also improving.

Analysts were less than ebullient toward the news, however. While the stock received several target price increases, there were no ratings changes. In fact, MAR’s average analyst rating sits between a buy and hold. The average target price ranges from $203 (right on its current price) down to $177, depending on the data source. And this is after the target increases. Either way, this is at best a sluggish endorsement of the stock, which is consistent with the ratings.

In contrast, MAR’s chart tells a more bullish story. The stock traded slightly higher after earnings through Friday amid a lower market. But the shares are up 36% in 2023, putting it on par with MSFT. Since late June, MAR has been on a solid rally covering 19% that included an all-time high on Wednesday. Currently, the stock has been trading well above its 20-day moving average, a trendline the stock has stayed close to throughout the runup. Note that the short strike of our put spread is at 195, a mark the 20-day just moved through.

This trade is based on MAR’s positive outlook, support from the 20-day moving average and analysts (hopefully) realizing that they have been too cautious toward the stock. MAR’s performance this year deserves better than what analysts have grudgingly offered.

If you agree that the stock will continue to respect its trendline support (blue line), consider the following credit spread trade that relies on MAR staying above $195 (red line) through expiration in 6 weeks:

Buy to Open the MAR 15 Sep 190 put (MAR230915P190)
Sell to Open the MAR 15 Sep 195 put (MAR230915P195) for a credit of $1.05 (selling a vertical)

This credit is $0.02 less than the mid-point price of the spread at Friday’s $202.98 close. Unless MAR surges at the open on Monday, you should be able to get close to that price.

The commission on this trade should be no more than $1.30 per spread. Each spread would then yield $103.70. This trade reduces your buying power by $500, making your net investment $396.30 per spread ($500 – $103.70). If MAR closes above $195 on Sep. 15, the options will expire worthless and your return on the spread would be 26% ($103.70/$396.30).

**We are crushing it! Subscribers had another great week after enjoying their best week in 3 years thanks to a monster 40% profit in our MSFT portfolio. Don’t miss out on the profits … now you can save more than 50% on a monthly subscription to Terry’s Tips. Just Click Here, select Sign Up Now and use Coupon Code D21M to start a monthly subscription to Terry’s Tips for half off.**

Making 36%

Making 36% – A Duffer's Guide to Breaking Par in the Market Every Year in Good Years and Bad

This digital book may not improve your golf game, but it might change your financial situation so that you will have more time for the greens and fairways (and sometimes the woods).

Learn why Dr. Allen believes that the 10K Strategy is less risky than owning stocks or mutual funds, and why it is especially appropriate for your IRA.

Order Now

    Sign Up For The Free Options Strategy Report & Our Newsletter Now!

    Sign up for Dr. Terry F Allen’s free newsletter and get immediate access to his most current report on his stock option trading strategies.

    tradier

    Tradier offers an auto-trade service which many Terry's Tips subscribers use to follow our portfolios.

    Member Login  |   Programs and Pricing  |  Testimonials  |  About Us  |  Terms and Conditions  |  Accessibility Statement  |  Privacy Policy  |  Site Map

    Options are not suitable for all investors as the special risks inherent to options trading my expose investors to potentially rapid and substantial losses. Please read Characteristics and Risks of Standardized Options before investing in options

    © Copyright 2001-2022 Terry's Tips, Inc. dba Terry's Tips
    235 Primrose Lane, Ferrisburgh, VT 05456